Overall, Americans prefer to maintain defense spending. But Democrats, younger people, and those with a college education prefer cuts, while Republicans prefer expansion.
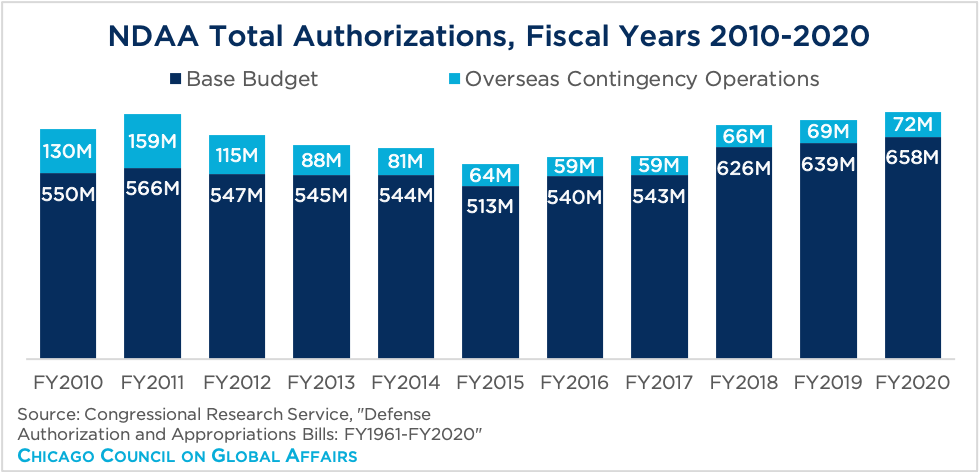
On December 8, the House voted to pass the 2021 National Defense Authorization Act (NDAA), authorizing a total of $740.5 billion in defense appropriations and continuing a trend of defense spending increases. The bill, passed by a margin large enough to override a threatened veto from President Trump, includes pay increases for US service members, mandates the renaming of ten US military bases currently named after Confederates, and has a notable focus on competition with China. The 2020 Chicago Council Survey finds that the US public overall tends to prefer to maintain current levels of defense expenditures. But a plurality of Democrats, younger Americans and the college-educated favor cuts to the US defense budget, while a plurality of Republicans favor expanding it.
Key Findings
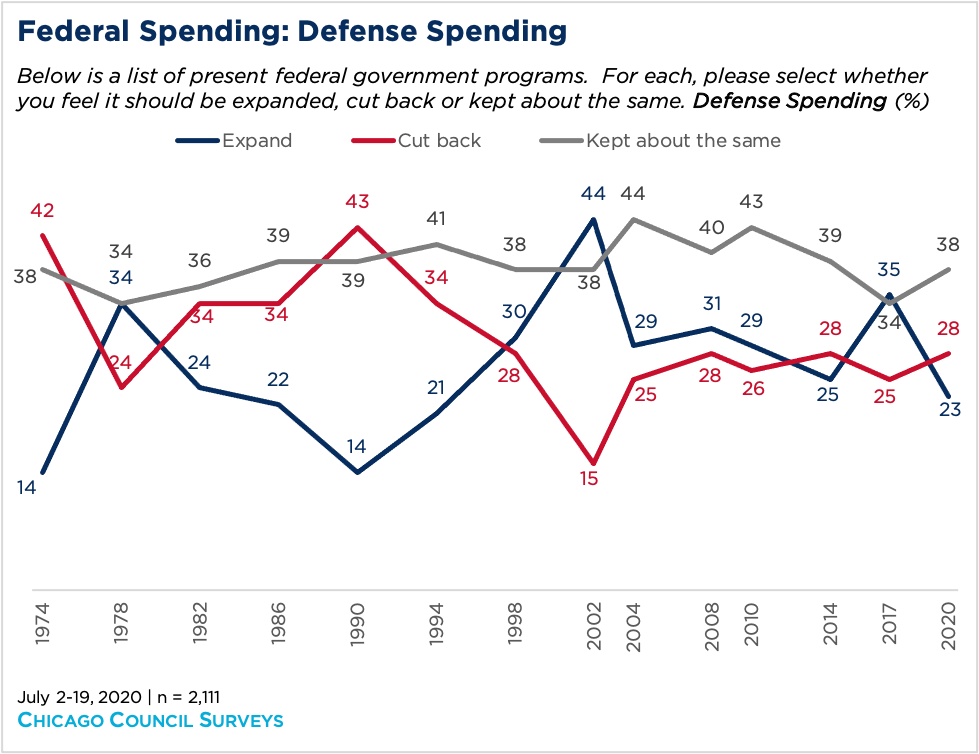
- A plurality of Americans (38%) favor maintaining US defense spending at present levels, while 28 percent favor cuts and 23 percent favor increases.
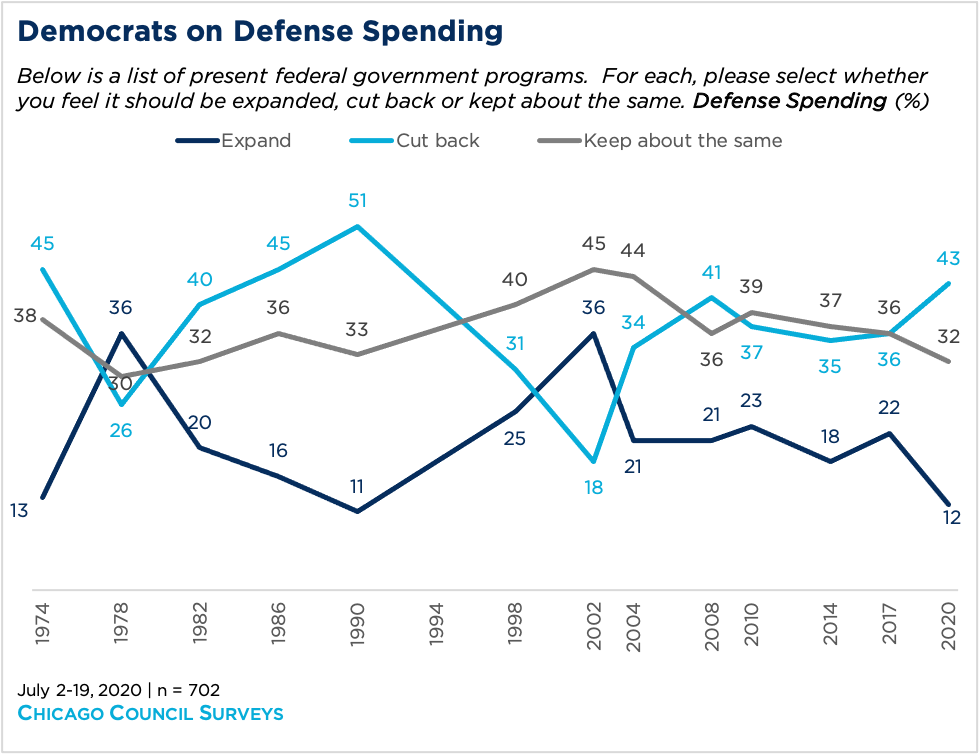
- A plurality of Democrats (43%) favor cuts to US defense spending, while a third (32%) want to maintain it at present levels. Few (12%) want to increase defense spending.
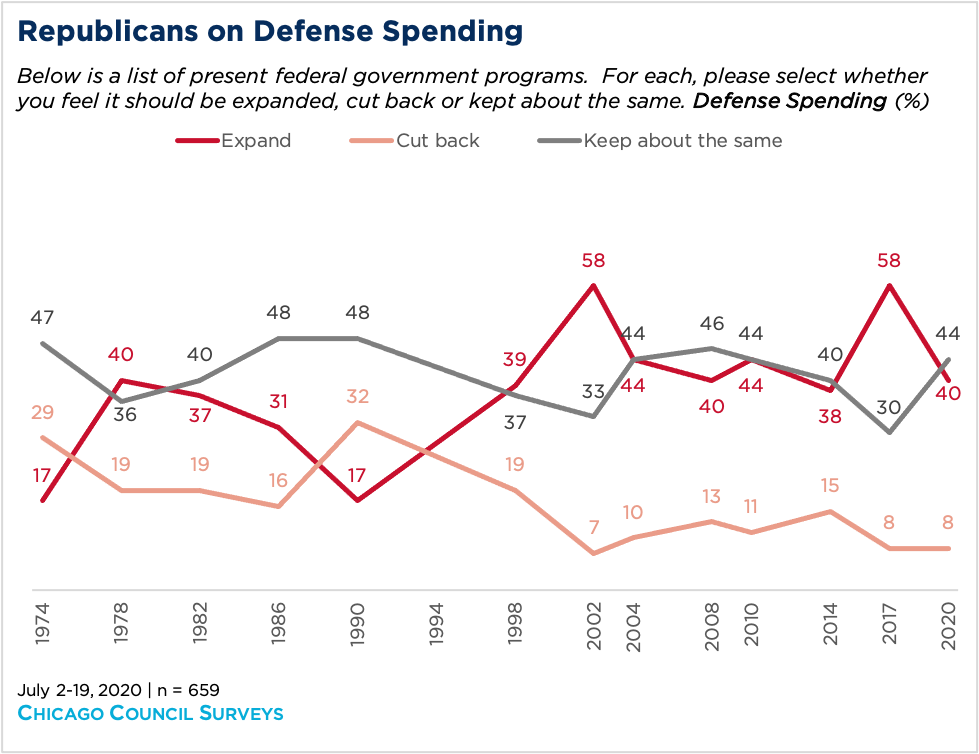
- By contrast, few Republicans (8%) want to cut the US defense budget, preferring to either maintain (44%) or increase (40%) defense spending.

Public Divided over Future Trajectory of Defense Spending
The 2021 NDAA’s total authorization of over $740 billion represents a continuation of an upward trend in US defense spending since FY2015 and marks a high point in authorizations over the past ten years, exceeding the FY2011 sum of $725 billion.
Results from the 2020 Chicago Council Survey, conducted July 2–19, 2020, find the American public divided over the future trajectory of US defense spending. A plurality of Americans (38%) say the United States should maintain its present level of defense spending, while 28 percent favor cutting back defense spending, and 23 percent support expanding it.
Since the first Chicago Council Survey in 1974, the proportion of Americans who favor maintaining US defense spending at existing levels has stayed relatively consistent, with between 34 and 44 percent of Americans favoring a steady-as-she-goes approach to defense spending.

Support for expanding or cutting US defense spending has swung far more over the past forty years. American public support for cutting it peaked in 1990, as the Cold War came to an end. But that support faded over the next decade and ended in an all-time high level of support for expanding defense spending in 2002, following the terrorist attacks of September 11, 2001. Since 2004, support for expanding or cutting defense spending has generally held steady, with the exception of a spike in support for expanded defense spending in 2017 during that year’s North Korean crisis. This year, with many Americans focused first and foremost on problems at home—primarily, the COVID-19 pandemic—defense spending attitudes have returned to the post-2002 norm.
Partisan Differences on Defense Increases or Cutbacks
However, this general stability in overall American attitudes masks deep partisan divisions between Republicans and Democrats over increases or cuts to defense spending. A plurality of Democrats (43%) favor cuts to the US defense budget, a position few Republicans share (8%). By contrast, four in ten Republicans (40%) favor expanded defense spending, which only 12 percent of Democrats support.
Democrats' support for cutting the defense budget has risen over the past three years. Today, a plurality of Democrats (43%) favor cutting back defense spending, up seven percentage points from 2017, when 36 percent said the same. Democrats’ support for increasing defense spending has fallen over the same period, from 22 percent in 2017 to 12 percent today. The proportion of Democrats who favor maintaining defense spending levels has also declined somewhat in recent years, from 39 percent in 2010 to 32 percent today.

Republicans start from a different point of view on defense spending, preferring to expand or maintain spending, with relatively little support for cutting it. Indeed, the last time in which more Republicans preferred cuts overexpansion was 1990, a time of dramatic change in the US security environment.
Since then, Republicans have been more consistently split between maintaining or expanding defense spending, with sharp increases in support for greater spending during moments of security crisis (such as in 2002, following the September 11 terrorist attacks, and in 2017, a period of great tension with North Korea).
Today, Republican support for expanding US defense spending has fallen back to the normal range of opinion since 2004. Similar proportions of Republicans favor maintaining current levels of defense spending (44%) or increasing it (40%); relatively few Republicans (8%) favor cuts.

Demographic Divides on Defense Dollars
While partisanship remains the most sharply divisive line in American views of defense spending, it is not the only such factor. Younger and older Americans also disagree notably about it, with older Americans far less likely to support cutting defense spending, while more than a third of Americans under 45 favor such cuts. Education, too, is a dividing line on defense spending: college-educated Americans are far more likely than others to favor cuts.
Views of Defense Spending across Demographic Groups
Please select whether you feel defense spending should be expanded, cut back, or kept about the same (numbers listed are percentages).
| Cut back | Kept about the same | Expanded | |
|---|---|---|---|
| Overall | 28 | 38 | 23 |
| Republican | 8 | 44 | 40 |
| Democrat | 43 | 32 | 12 |
| Independent | 30 | 40 | 21 |
| 18-29 | 36 | 32 | 18 |
| 30-44 | 35 | 33 | 21 |
| 45-59 | 27 | 40 | 24 |
| 60+ | 18 | 45 | 28 |
| White, non-Hispanic | 26 | 40 | 25 |
| Black, non-Hispanic | 25 | 37 | 22 |
| Other, non-Hispanic | 38 | 40 | 15 |
| Hispanic | 35 | 31 | 21 |
| 2+ races, non-Hispanic | 31 | 34 | 21 |
| Female | 26 | 37 | 23 |
| Male | 31 | 39 | 24 |
| Less than high school | 16 | 34 | 22 |
| High school | 19 | 41 | 29 |
| Some college | 27 | 40 | 27 |
| Bachelor's or higher | 41 | 35 | 16 |
| Urban | 36 | 34 | 19 |
| Suburban | 27 | 40 | 23 |
| Rural | 16 | 41 | 33 |
July 2-19, 2020 | n = 2,111
Source: Chicago Council Surveys
Methodology
This analysis is based on data from the 2020 Chicago Council Survey of the American public on foreign policy, a project of the Lester Crown Center on US Foreign Policy. The 2020 Chicago Council Survey was conducted July 2–19, 2020, by Ipsos using its large-scale nationwide online research panel, KnowledgePanel, among a weighted national sample of 2,111 adults, 18 years or older, living in all 50 US states and the District of Columbia. The margin of sampling error for the full sample is ±2.3 percentage points, including a design effect of 1.2056. The margin of error is higher for partisan subgroups or for partial-sample items.
Partisan identification is based on respondents' answer to a standard partisan self-identification question: "Generally speaking, do you think of yourself as a Republican, a Democrat, an Independent, or what?"
The 2020 Chicago Council Survey is made possible by the generous support of the Crown family and the Korea Foundation.


